Working With Image Histograms
For photographers, understanding light and color is a very important skill to learn. These are the basic elements of a photograph, and they will make or break your shot. The histogram is a vital tool for assessing the light and color in an image, yet it's not widely used or understood by many people yielding a camera. Understanding the histogram will not only help while taking photos, but also with post-processing.
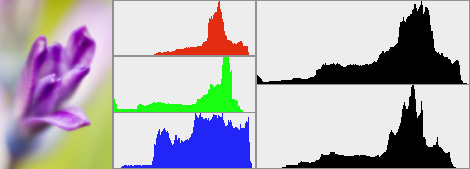
In the images below, I've shown (from top to bottom and left to right) the histograms for the red channel, green channel, blue channel, RGB composite, and Luminosity. Each histogram tells us something different about the photo. The color histograms show the distribution of specific color components with the left of the histogram representing no color (0% color saturation) and the right representing full color (100% color saturation). The RGB composite histogram is a combination of all three color histograms and it represents the tonal range for that image. The Luminosity histogram shows the distribution of luminance (brightness) values from black to white.

The shape of a histogram is not terribly important, but there are several key pieces of information that can be drawn from them. The spread of the histogram relates to contrast, meaning that a very narrow histogram will be representative of a low contrast image while a histogram that covers most of the scale will be higher contrast. Peaks in the histogram can tell you whether you have a high key or low key photo, or a very high contrast photo if you have a peak at each end of the histogram.
Clipping can be identified with the histogram, which causes a loss of data. Color clipping occurs when the individual color histograms are shifted so far to the right that one or more colors are at 100% saturation for a group of pixels. This means that you lose tonal contrast in those pixels for that color, but it's not always detrimental to a photo. Luminance clipping is a much more serious crime in photography. If the luminosity histogram is clipped at either end, you've lost information in either the shadows or highlights (or both). No amount of editing can bring back that portion of the image.

How is any of this usable when taking photos? Well, most cameras have a histogram display in the playback mode. Some cameras just show the RGB composite, some show luminance, and others will give you everything. Your camera is only capable of capturing a certain range of tones, which is lower than what your eye can capture. This is your camera's dynamic range — dynamic because it can be shifted using exposure controls. If it looks good through the viewfinder, it doesn't mean that it will look good in the camera. A quick check of the histogram can tell you if you're trying to capture a higher than possible range of light, if you're shifted to one side or the other, and if you've got any clipping in the shadows or highlights.
At a minimum, it's a good idea to check the histogram for clipping each time you change scenes. I typically check on my first shot to see if I need any exposure adjustments. If I'm clipping highlights, I'll bring the exposure down to shift the histogram. If I'm clipping shadows, I'll bring the exposure up to shift the histogram. If I'm clipping both, I'll bring the exposure down to salvage the highlights. Blown out highlights are typically more distracting to an image than under exposed shadows. If I really want to get the whole range, I'll bracket my shot and bring them together as a High Dynamic Range (HDR) image.
There's nothing more frustrating than getting back to review your shots of the day to find that several sets are either under exposed or over exposed. Sometimes you can't go back and do it again, so get it right the first time.
So in summary: left is dark, right is bright, clipping is bad, salvage the highlights, and check you camera's histogram often.
Here are a few more sites that go more in depth on the subject:
- Cambridge in Colour – Image Histograms
- Cambridge in Colour – Luminance and Color Histograms
- Photography Review – Histogram Guide
- Luminous Landscapes – Understanding Histograms
- Ken Rockwell – How to Use Histograms
If you have any other tips on histograms (or corrections to my explanation), make a comment and share your knowledge.
Brian Auer
April 15, 2007Thanks Paul. It’s a huge subject, so I tried to just cover the basics to introduce it.
Paul
April 15, 2007great introduction to histrograms…