Linear Curve Adjustments and Histograms
In the previous article on the topic of Photo Editing with Histograms, I discussed the six basic adjustments found in Adobe's raw processing engine and how those settings affect the image and the image histogram. Then I posted a poll asking your experience level with curves, which also offered up some basic concepts and links for further reading. I also posted a few videos having to do with curves adjustments. So if you've been following along, you should have a decent grasp of how the tool works.
In this article, I'll be discussing how various curve adjustments affect the image and the image histogram — but only in the realm of linear curves. So… linear… curves? Yup, you can do straight lines in the curves adjustment and they have their applications. So let's look at a few extremes, then I'll show you how to apply the linear adjustment to an image in need. After this, we'll dive into the curvy stuff. And after that… I'm sure I'll have something else to ramble on about.
LINEAR MANIPULATIONS
Let's just start with some basic straight-line adjustments. Wait… isn't this supposed to be about curves? Have no fear, we'll get there — but these basic concepts are essential for the advanced concepts. Keep in mind throughout these examples that the input scale is along the bottom of the curve dialog and the output scale is along the left side of the dialog.
Each of the following examples shows the curve dialog overlaid with the base histogram, the adjusted histogram, and the base image from bottom to top. The original image is shown in example 3.
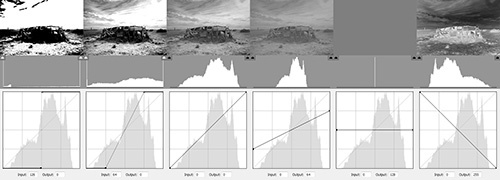
What I'm showing above is a spectrum of linear manipulations within the curves dialog. We start at full contrast and work our way to zero contrast, followed by negative contrast. Let's go through them one by one…
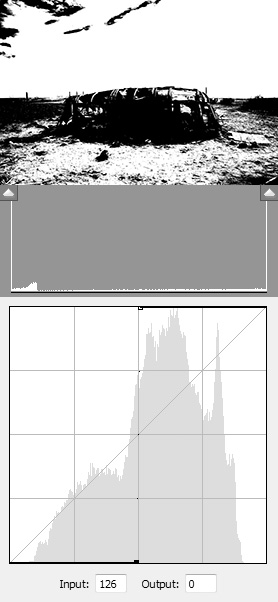
The first image shows what would happen if your curve was pushed vertical. What I'm doing is taking all the pixels with tones to the left of the line and forcing them to be black. I'm also forcing all pixels with a tonal value to the right of the line and forcing them to be white. Everything between the set black and white points is scaled according to the diagonal line, thus we see a higher contrast (remember what I said about slope a few days ago?).
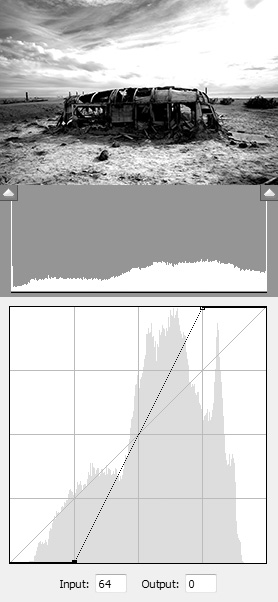
The second image shows a high contrast linear curve. This is very similar to the previous example, but I'm allowing midtones to remain somewhere between black and white. I'm still forcing black and white pixels, but not to the extreme as with the vertical line adjustment.
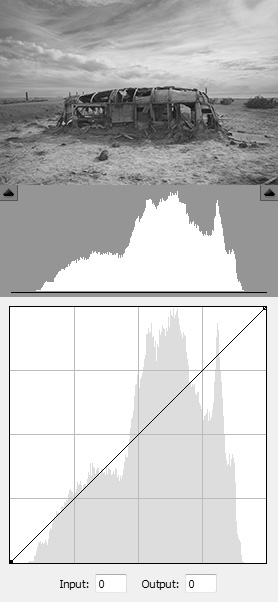
This third image shows absolutely nothing — it's what we started with. A perfect diagonal line from the upper right to the lower left corner represents a perfectly untouched input/output relationship.
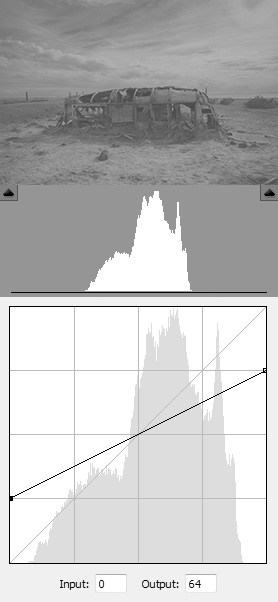
The fourth image shows the opposite of the second image. Here, I've moved the black and white points along the edge of the box, but in the other direction. This tells the software to convert all perfect black pixels to some level of dark gray, and all perfect white pixels to some level of light gray. Everything between black and white is scaled accordingly, thus we see a lower contrast.
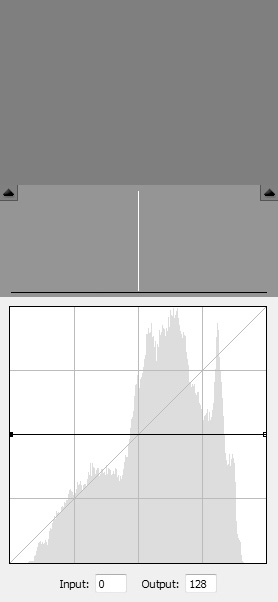
The fifth image shows a perfectly horizontal line — exactly opposite from the first image of absolute contrast. What I've done is mapped every single input tone to output a single tone value. All blacks, grays, and whites are now a single tone value.
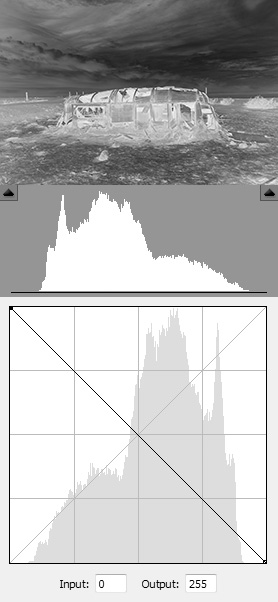
And our final image shows the opposite of image three. I've turned the curve upside down, inverting all the tones. Blacks map to whites, whites map to blacks.
APPLYING LINEAR CURVE ADJUSTMENTS
Those of you acquainted with curves and levels will say “linear curves can be accomplished with levels!” True. I'm not disputing that fact, I'm just showing how to use curves in a linear fashion. For those using Lightroom or ACR, they don't have access to levels within the raw processor interface.
At any rate, here's how I would apply a curve adjustment to the base image/histogram.
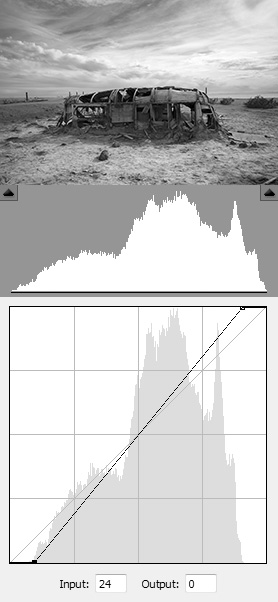
So what did I do here? If you look close, you'll see that I basically did a version of #2 shown above. I set my black and white points so that my histogram spans the entire tonal range. This gives me a true black and white tonal value in the image. Of course, it's not perfect at this point, but it's a hell of a lot better than it was!
This is the most used real-world application of the linear curve adjustment — setting your black and white points. There are other uses depending on your artistic vision, but you'll have to explore those yourself.
So now that we've covered the linear adjustments, let's move on to the non-linear stuff! Any questions on the linear adjustments?
C.T.Daniel
February 5, 2010Bryan Villarin
February 10, 2010Ah, I think I understand it now. Thanks Brian!
Luis Murillo
February 15, 2010I like these tutorials, really getting to know more on how to use the curves. Also I wanted to mention that Lightroom does have curves…but they have limits so you can’t do a complete straight line and “ruin the image”, or so it’s said by the Adobe Lightroom team
Brian Auer
February 16, 2010Interesting… maybe Lightroom has some additional controls or restraints. I did all these in Adobe Camera Raw, which is supposed to have basically the same controls.